Monitoring playbooks let’s you oversee and analyze automated workflows designed to address security incidents and their specific automated response. It involves tracking the parameters taken as input by each action block, the execution and status of each action block, performance metrics of the playbook, alerting, error handling, and continuous improvement of these pre-defined playbooks.
Monitoring Playbooks
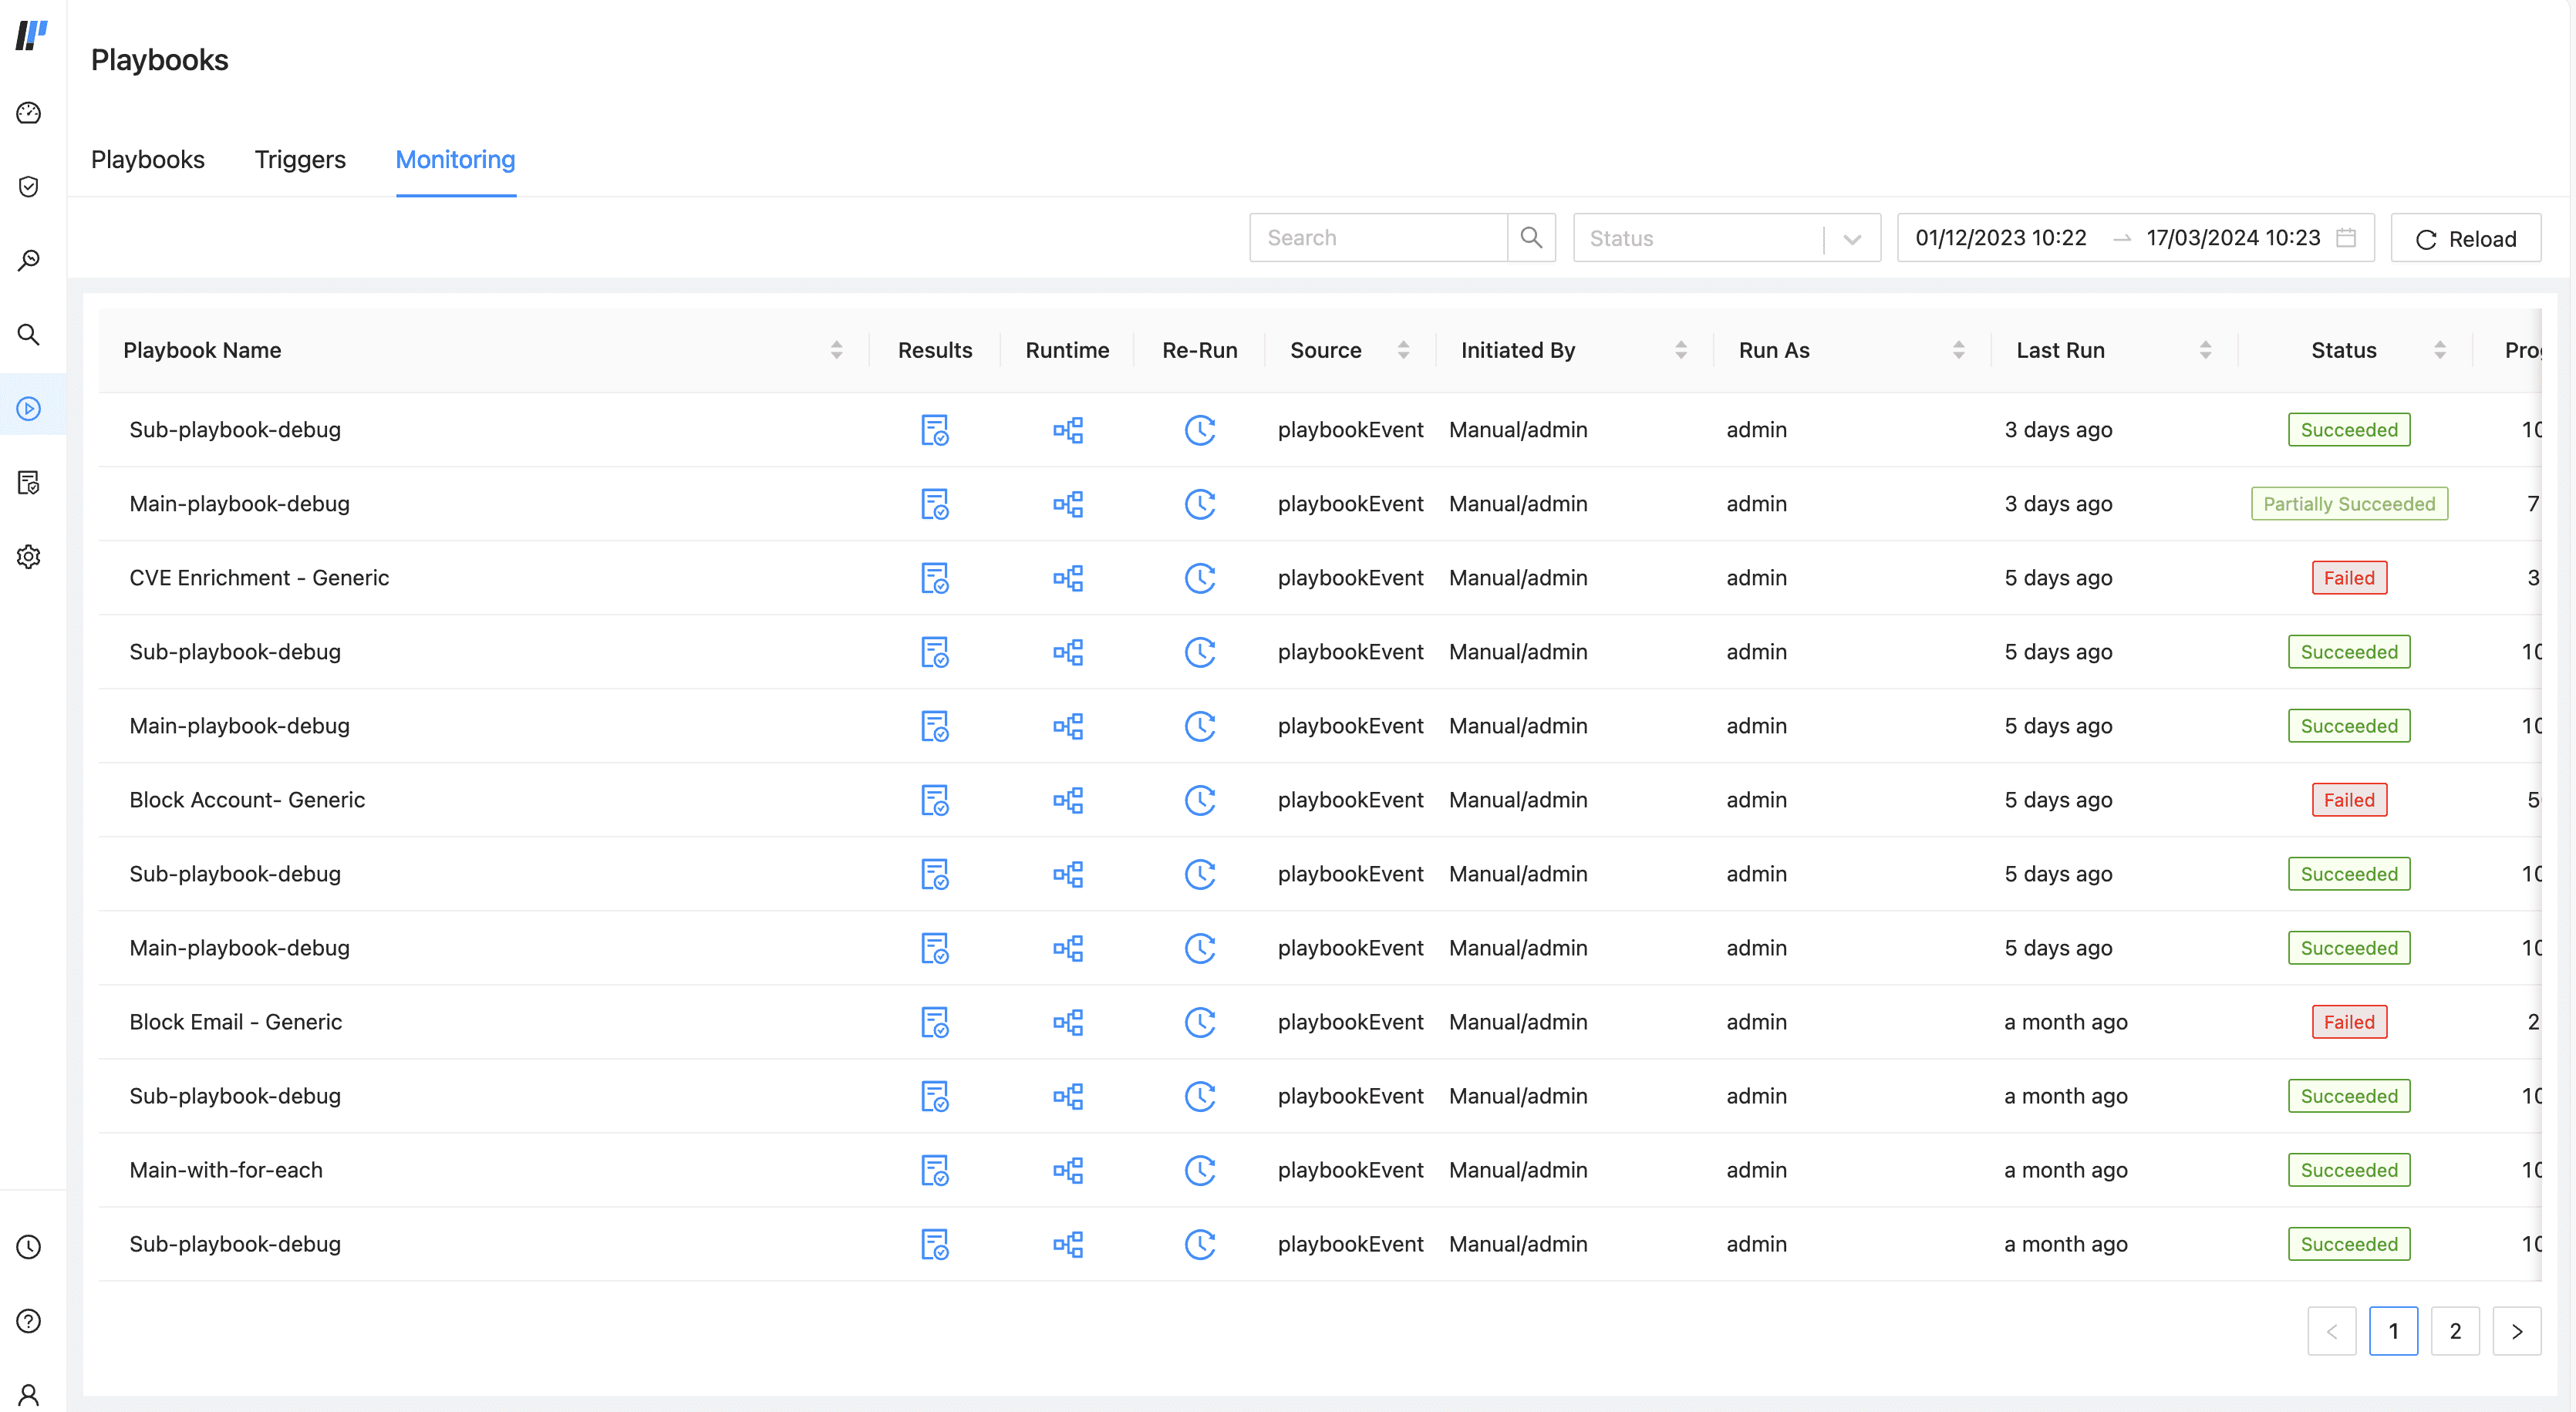
You can filter the results based on the Playbook Name, Status of the execution, and date-range. You can also refresh the list by clicking Reload.
The Playbook Monitoring list includes the following fields for each executed playbook:
Playbook Name
Results of the executed playbook in the JSON format.
Runtime takes you to the playbook’s Runtime Mode where you can see the status of all the actions.
Re-Run
Source
Initiated By is the user who triggered the playbook.
Run As
Last Run time.
Status of the execution.
Progress of the execution in percentage.
Number of Total Actions in the playbook.
Number of Completed actions.
Start time
End time
Duration of the execution.
Playbook execution Status can be:
Partially Succeeded
Succeeded
Failed
Cancelled
Skipped
Paused
Stopped
Runtime monitoring involves observing and analyzing the execution of automated workflows during active incident response or through manual execution of a playbook. Runtime monitoring ensure that playbooks function correctly and efficiently in real-time.It focuses on metrics related to playbook execution such as Duration, Status, Progress, Total Actions.
In Monitoring, find the relevant playbook under Playbook Name.
Click the Runtime icon next to the playbook.
The playbook canvas displays the executed playbook and all its actions. Each action in the playbook is marked with a specific color. What each color means, or what status it reflects, is listed in the legend at the bottom of the playbook canvas.
Clicking on the action block, you can find the details about the input parameters, output parameters, and the errors encountered by the Action block.
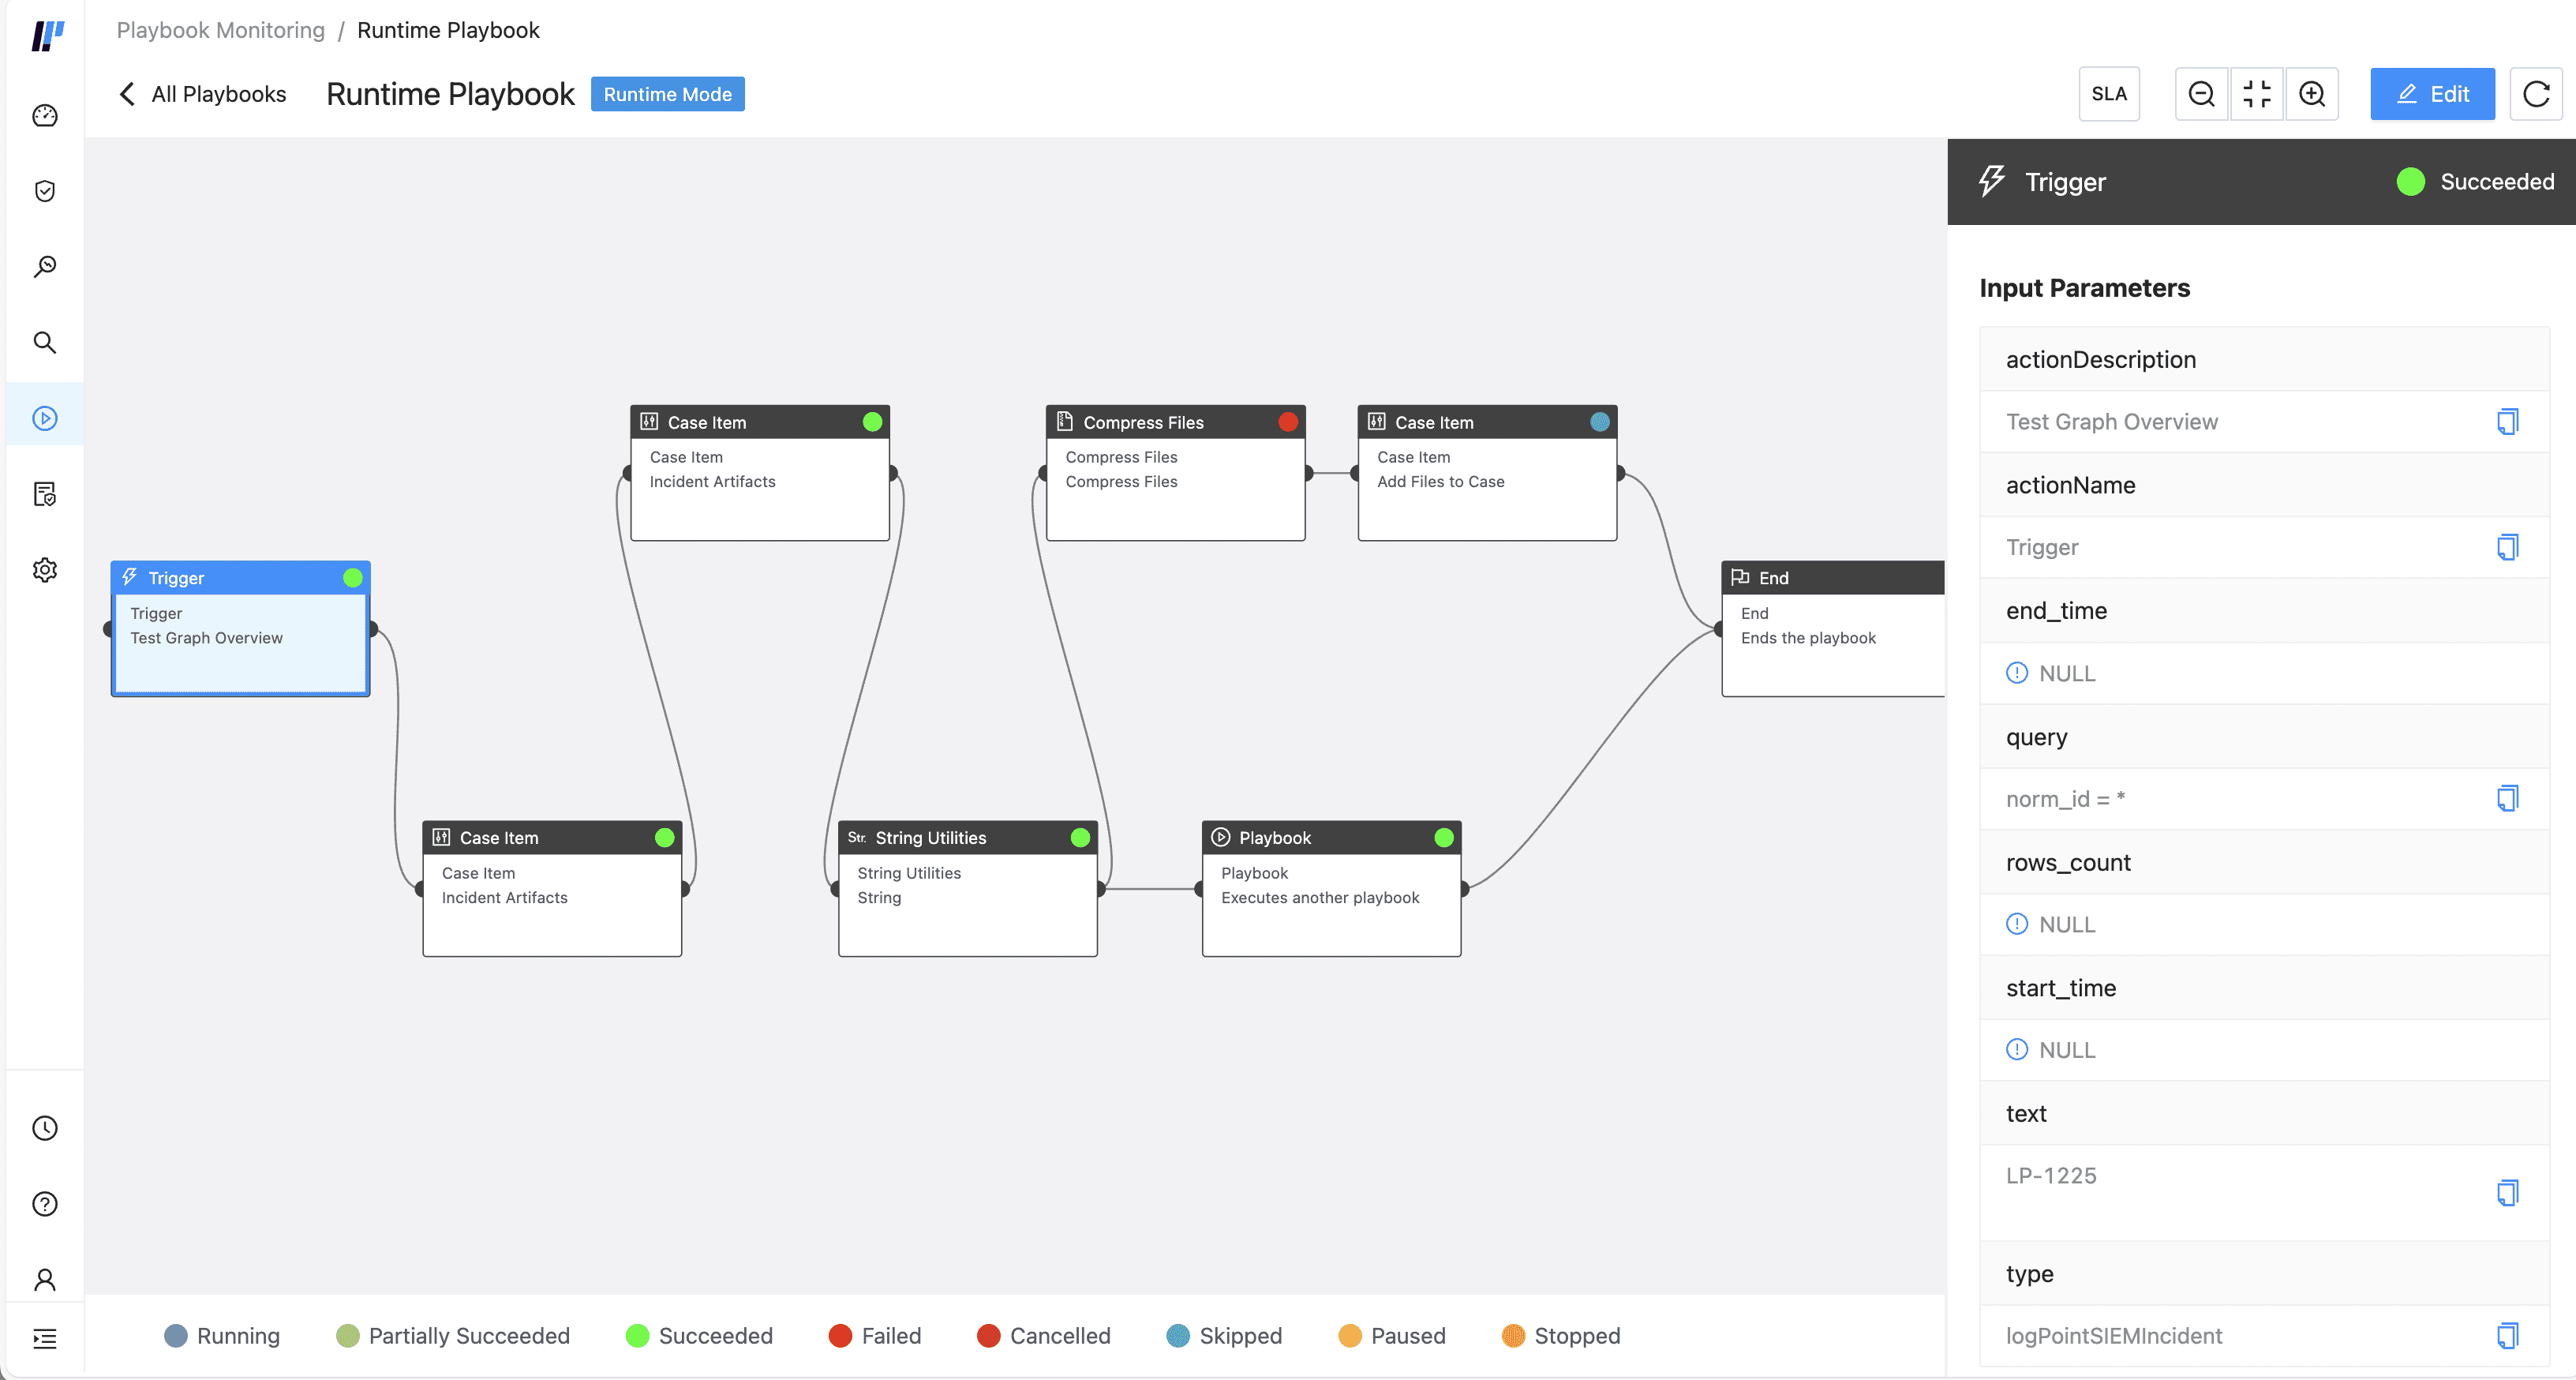
Playbook Runtime Monitoring
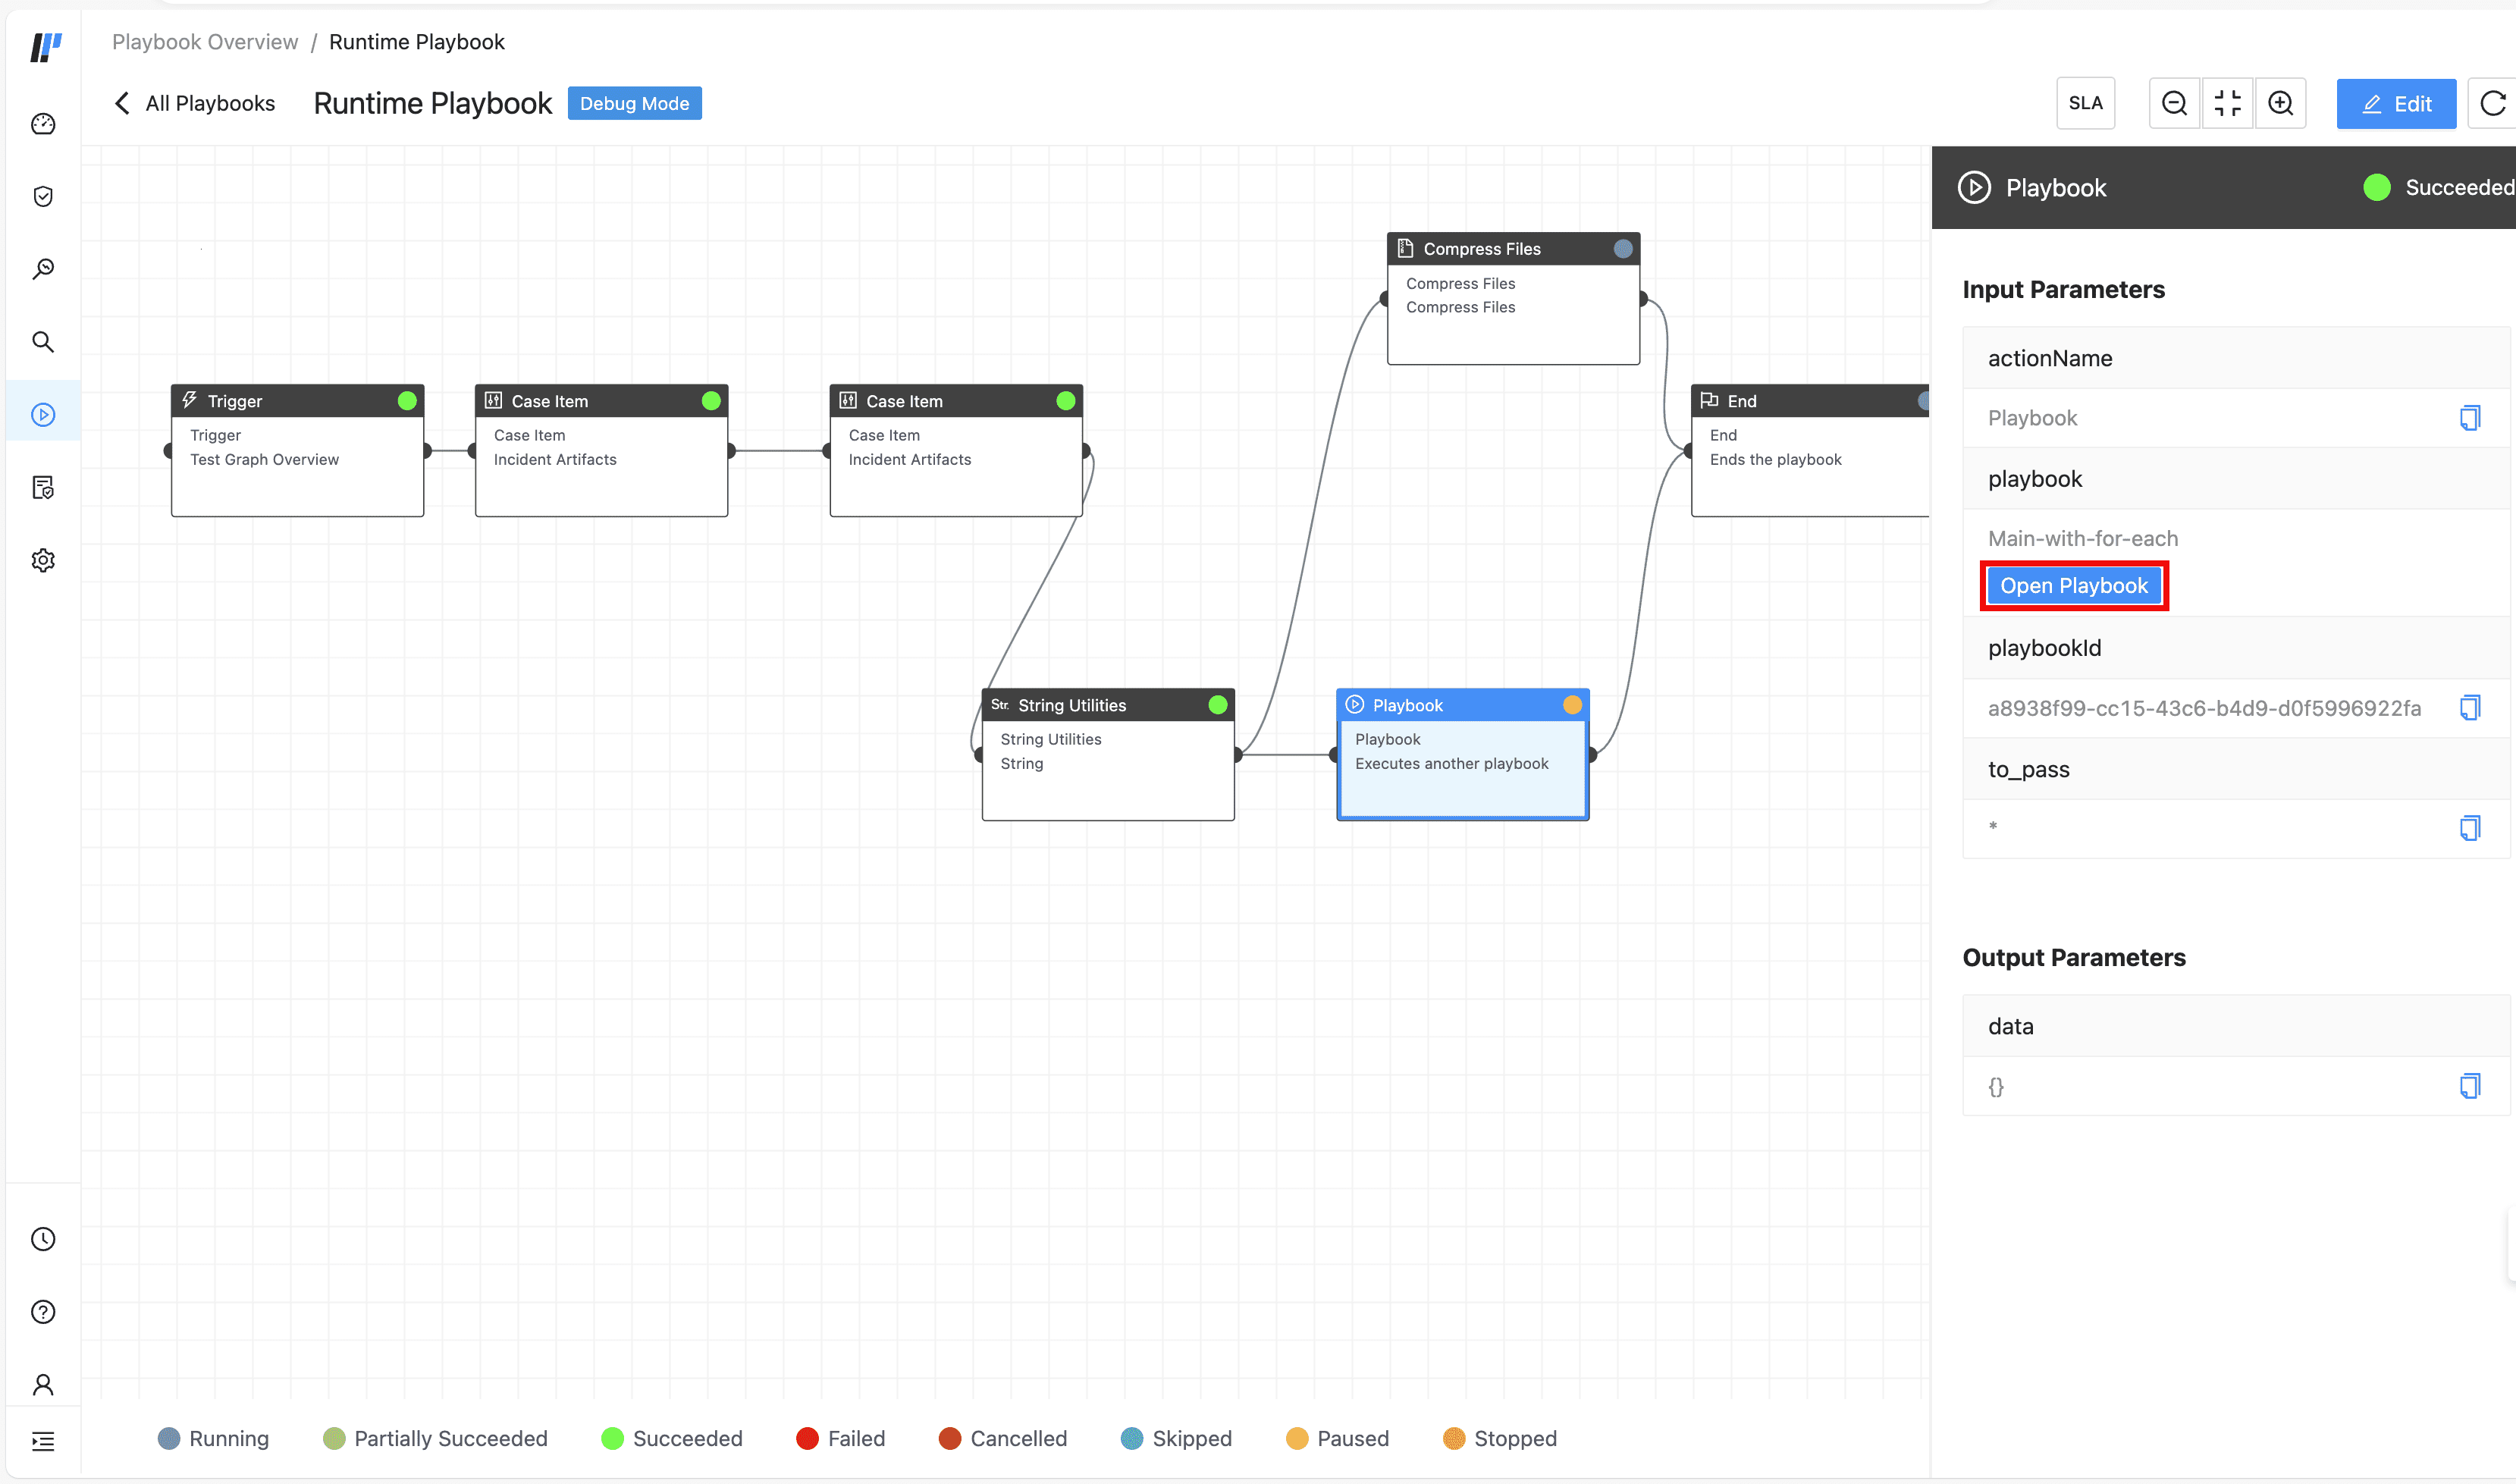
You can also further monitor a playbook’s sub-playbook. Click Open Playbook in the relevant playbook action block.
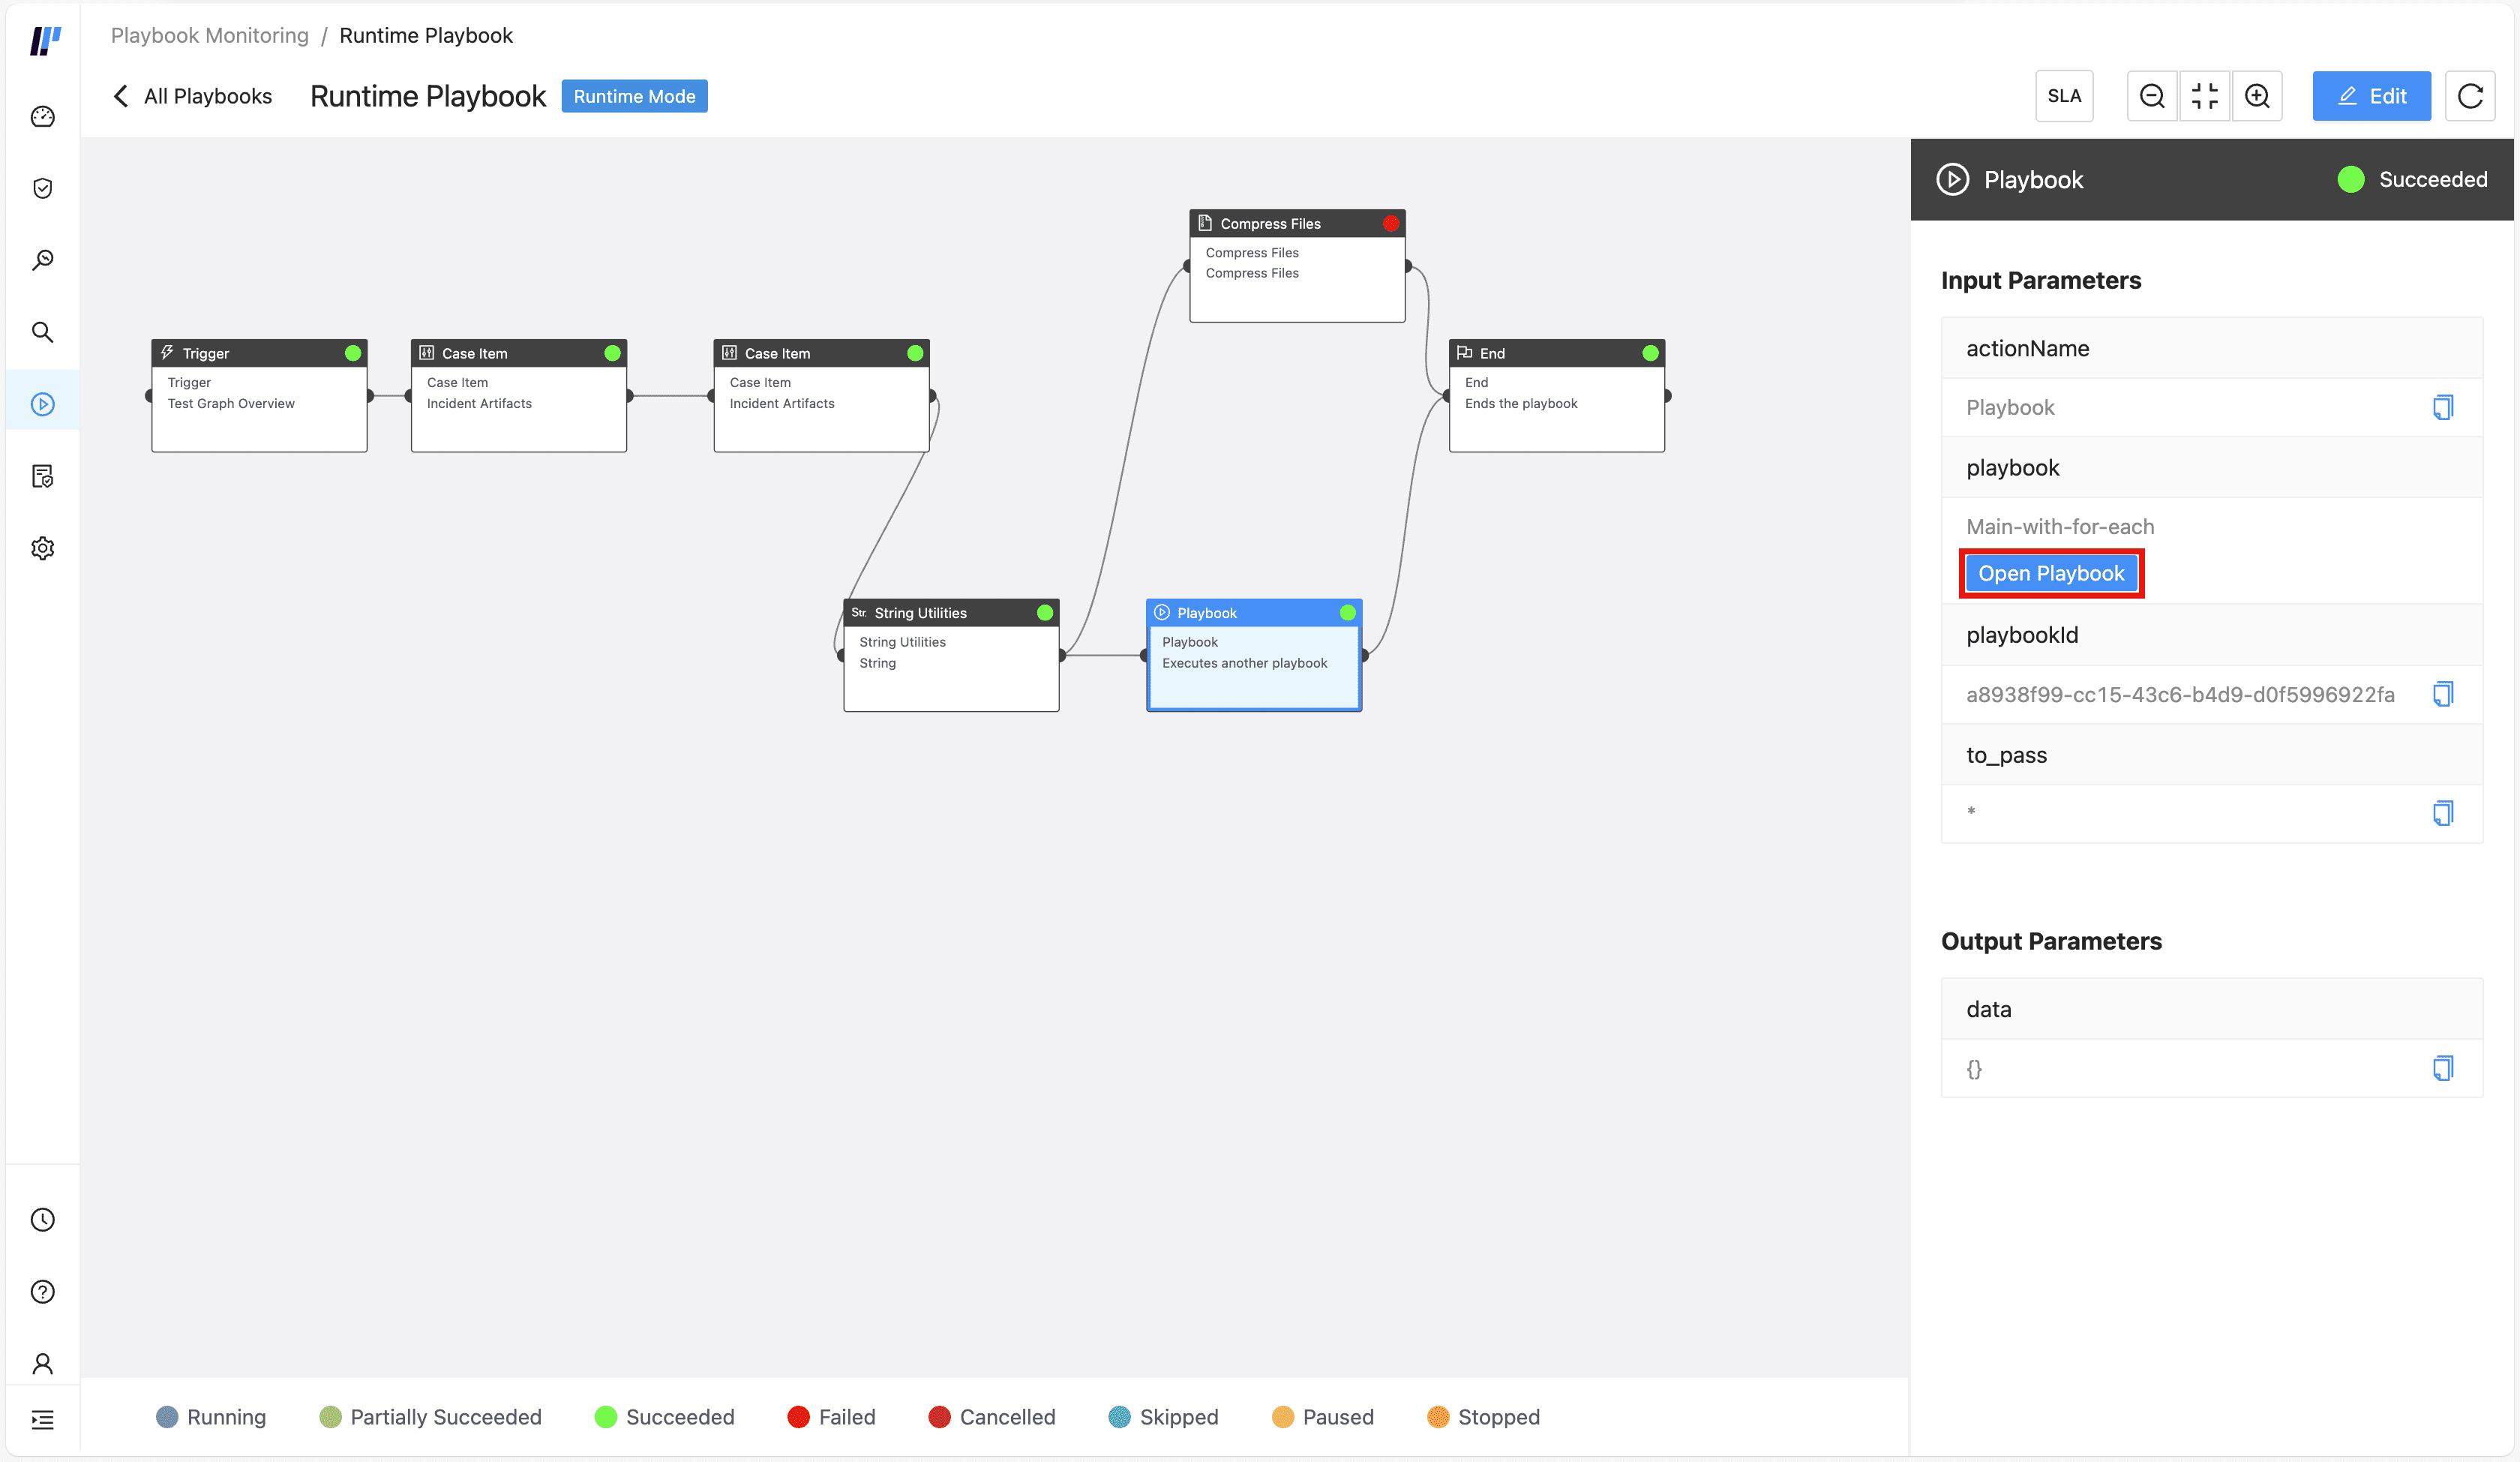
Open Sub-playbook
Important
Open Playbook is not available when Playbook action block is followed by For Each action block.
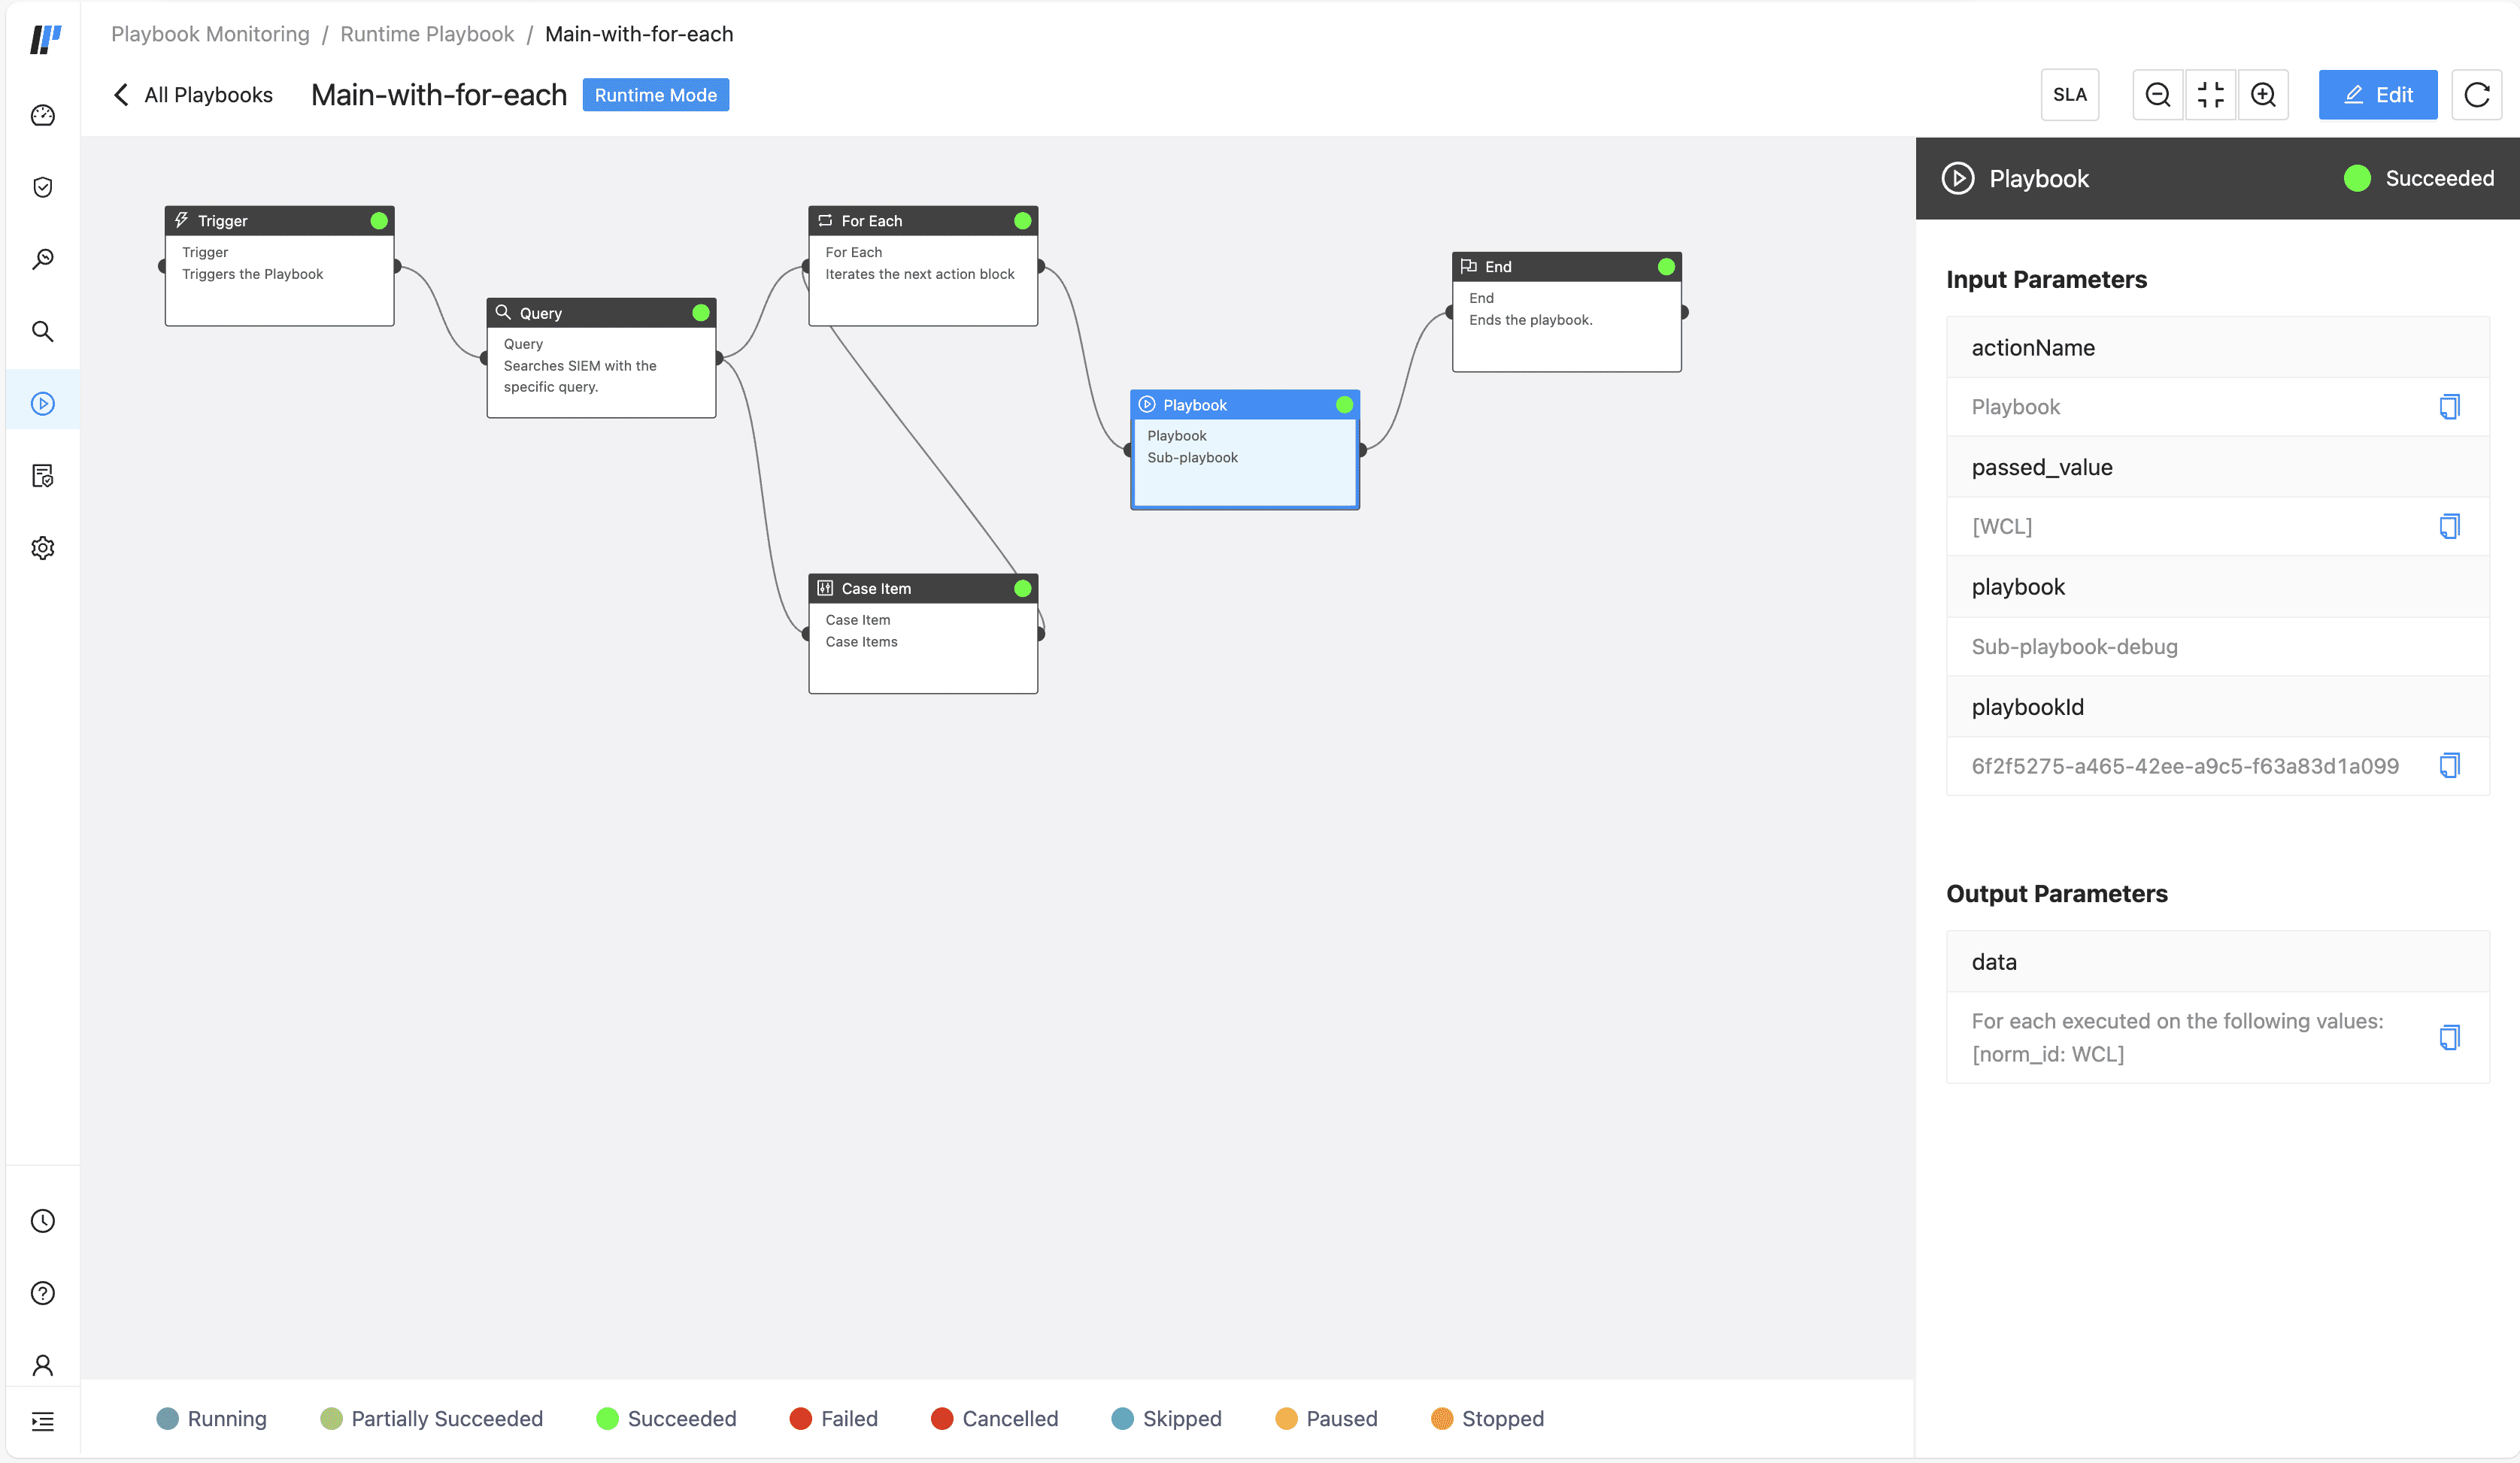
Opening Sub-playbook
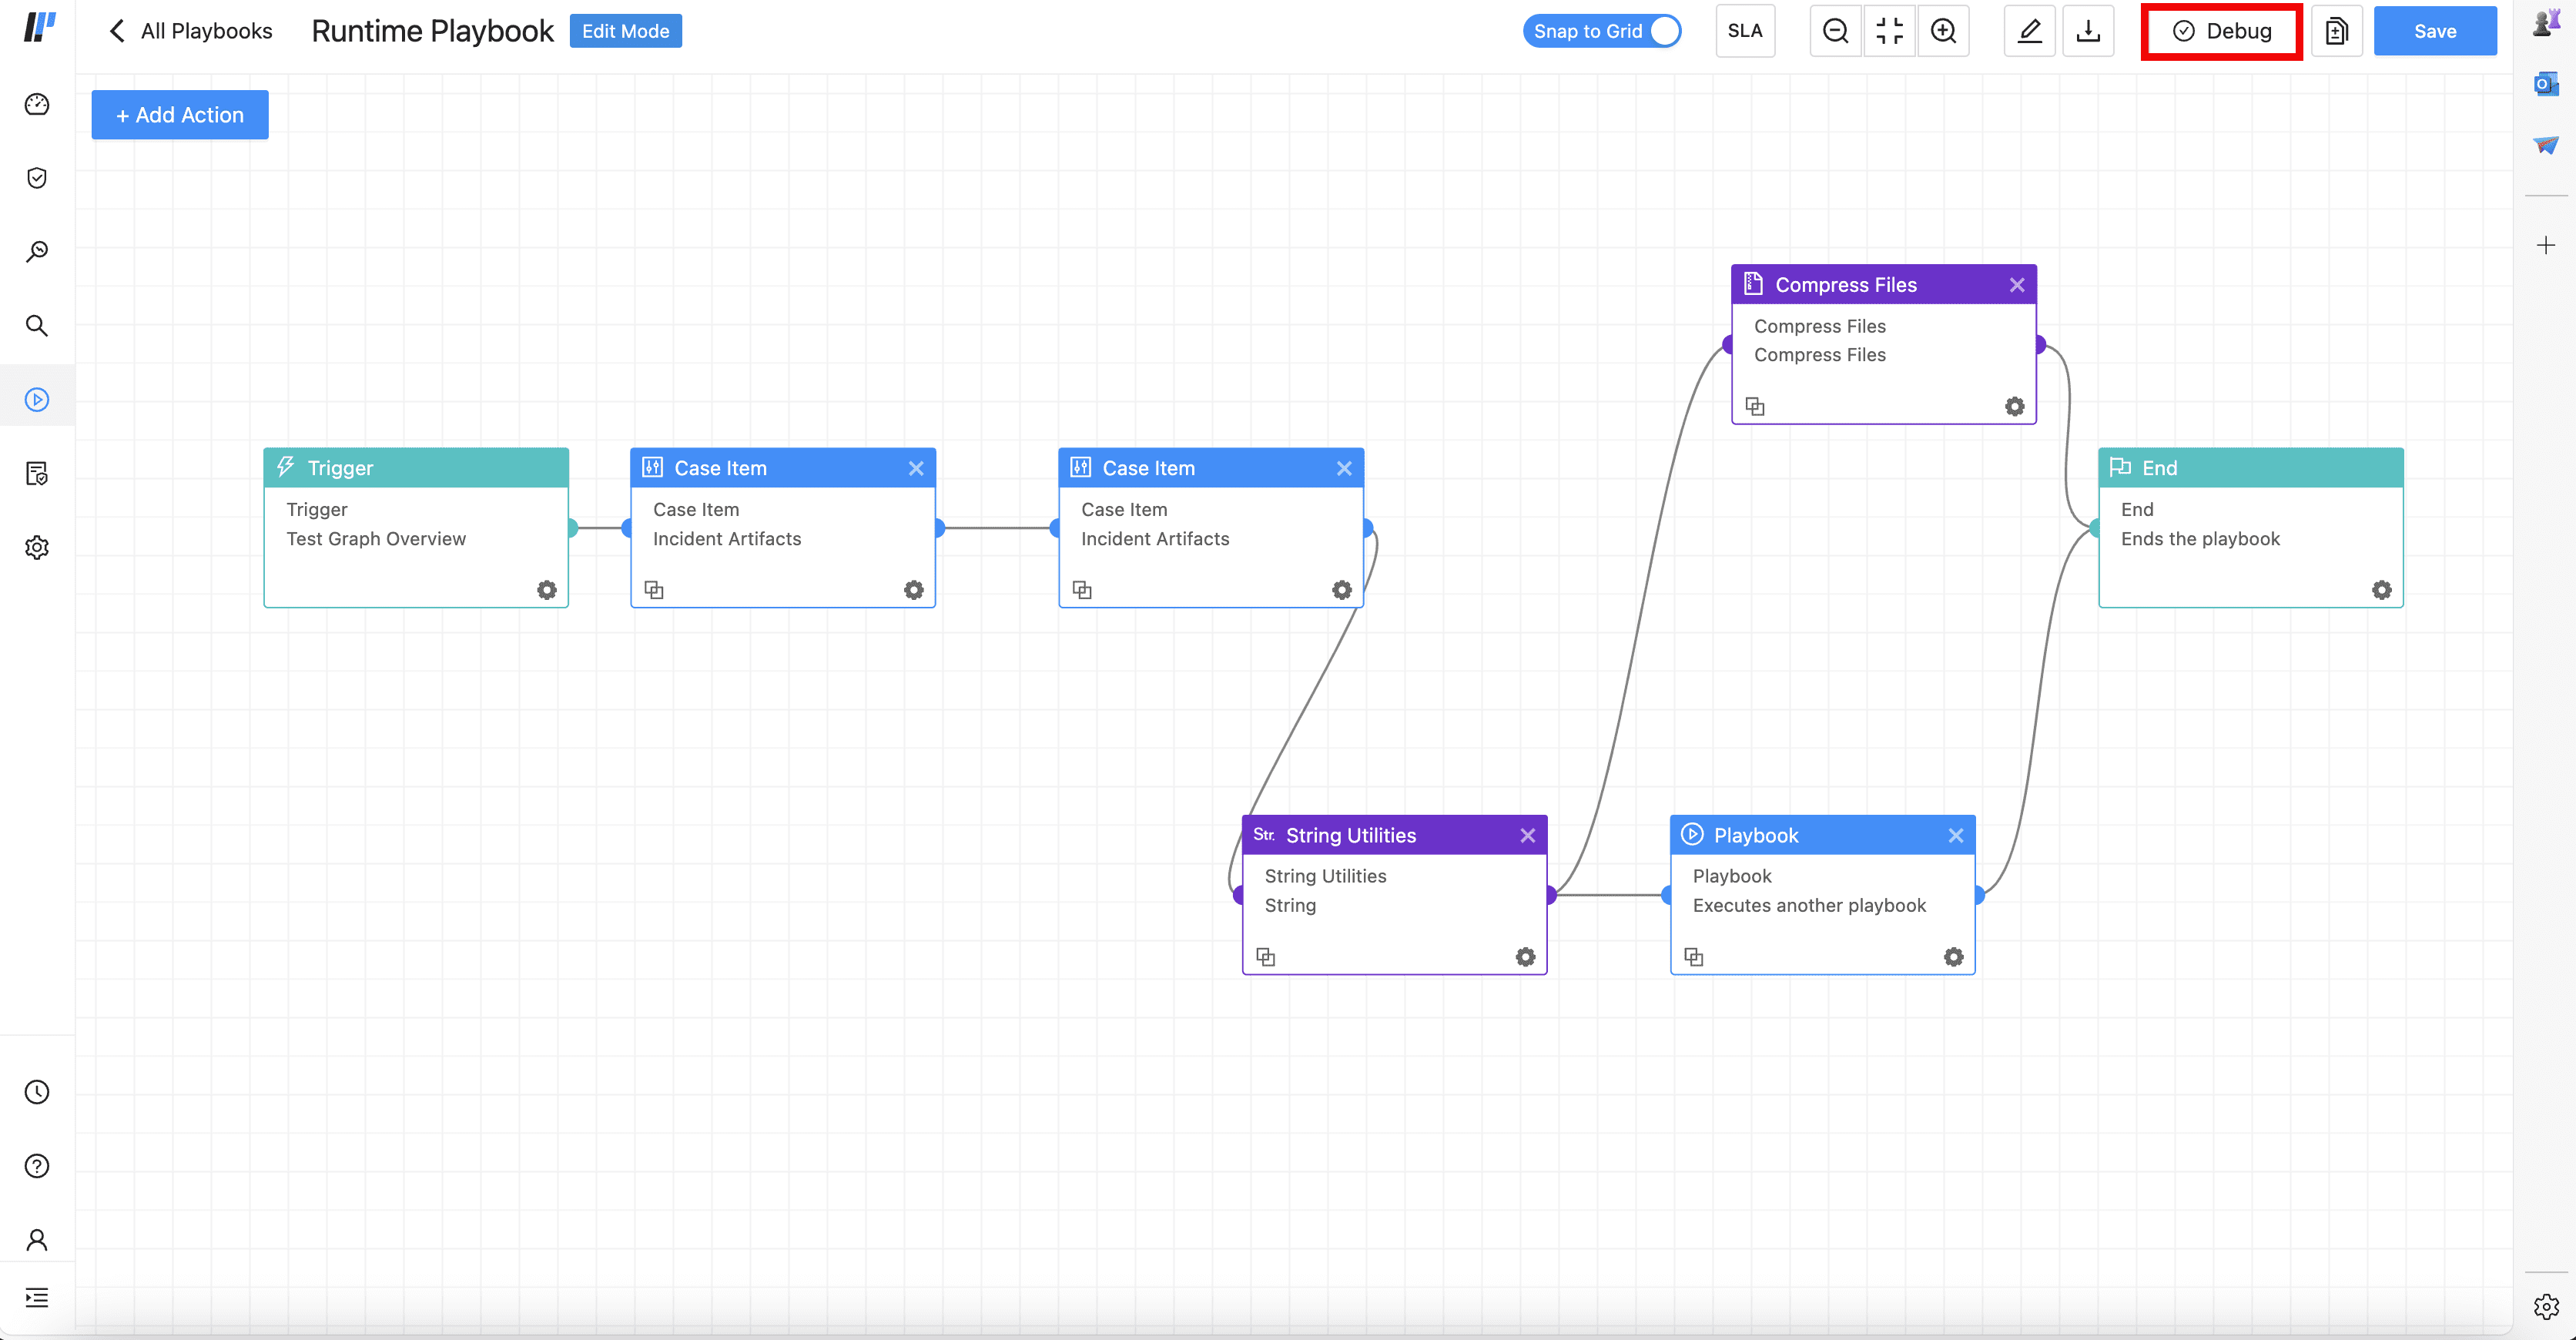
Debug monitoring involves analyzing and troubleshooting issues related to the configuration, functionality, or performance of playbooks before real-time execution. This involves testing and fine-tuning automated conditional logic and workflows, verifying custom scripts, decision trees, or API integrations. Debugging ensures that playbooks function the way they should during live incident response.
To debug a playbook, click on a playbook and click on Debug.
You can also further debug a playbook’s sub-playbook. Click Open Playbook in the relevant playbook action block.
Important
Open Playbook is not available when Playbook action block is followed by For Each action block.
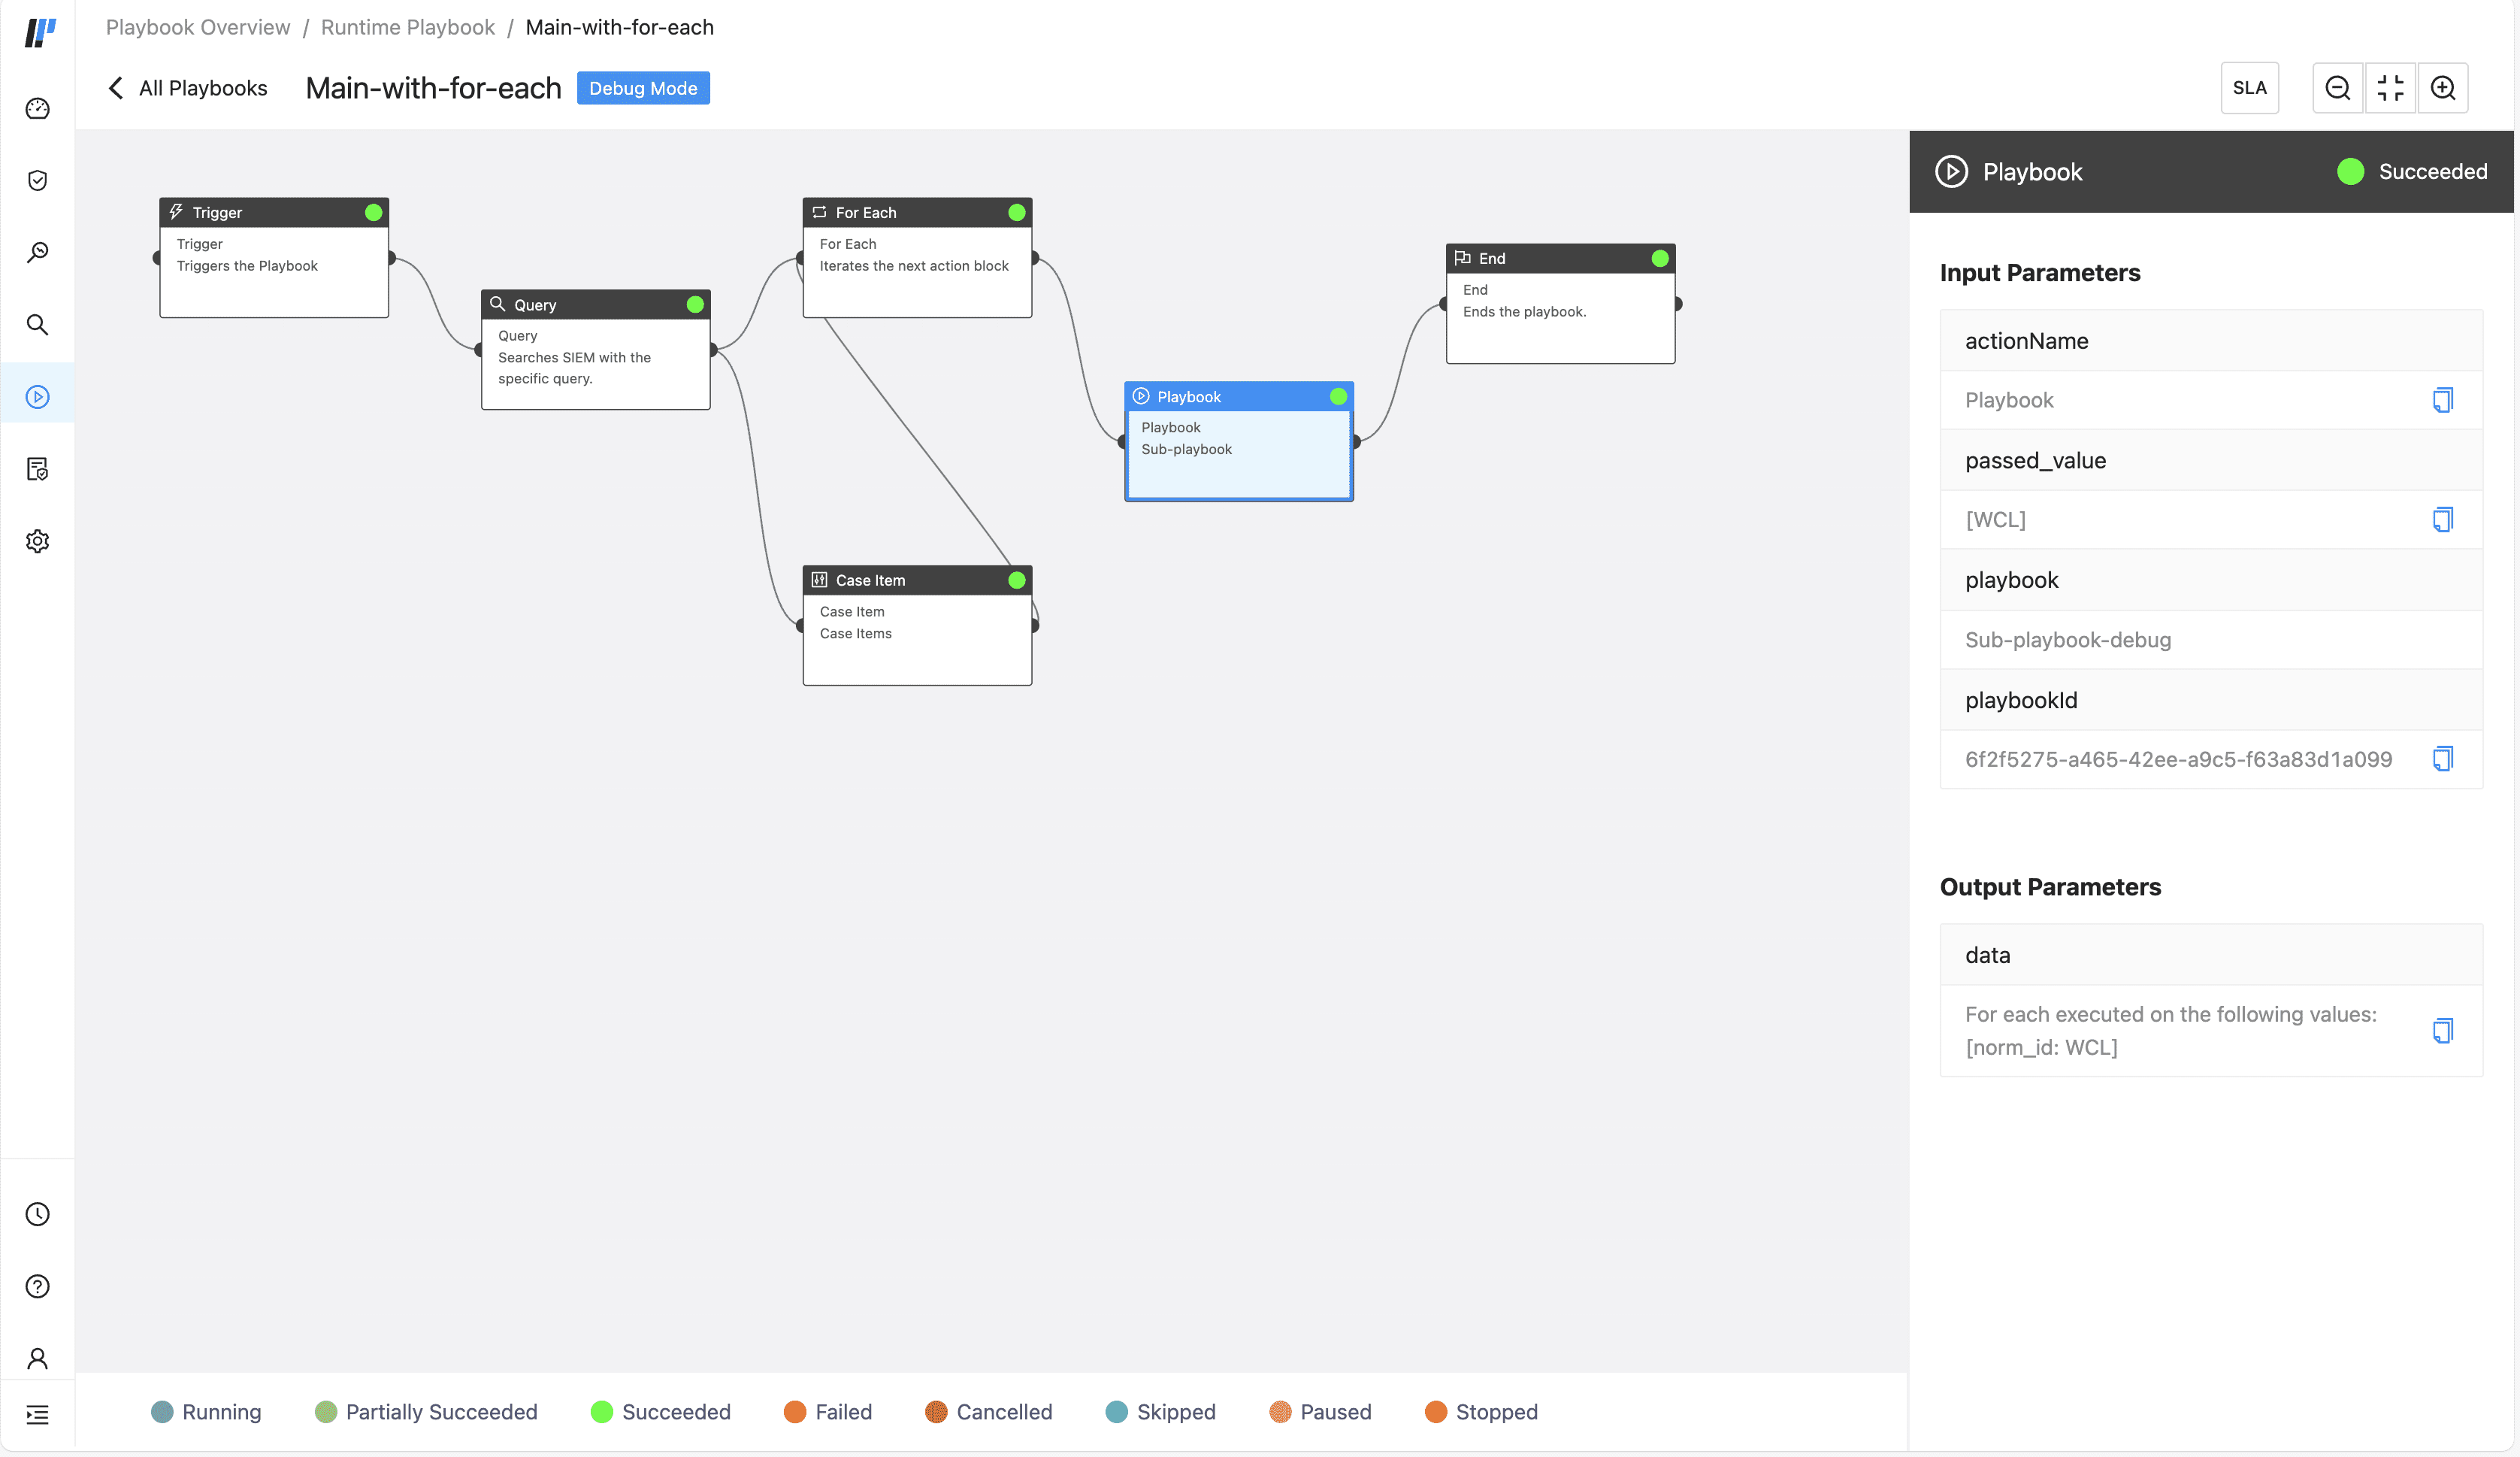
Opening Sub-playbook